Public transport boardings
Shared Travel
This metric assesses the rate at which shared travel has been taken up across Australia, tracking the share of kilometres travelled by passengers using shared transport, as a proportion of all travel using motorised options.
Where are we at?
At the moment, our car-centric transport system leaves too many Aussies with little choice in how to get around. This is driving harmful climate pollution while also making our streets more congested, dangerous and polluted. Australian families are paying more than they should for petrol and maintenance costs, particularly in the outer suburbs of our biggest cities where people often have to drive further and more often. Across Australia’s five largest cities, seven million of us are missing out on convenient, frequent and reliable public transport.
Why does this matter?
68% of Australians live in cities in high density and travelling shorter distances than those in rural areas, which presents a huge opportunity to do more.
Fortunately, solutions are available now, and all levels of government are jumping on board to improve shared and active transport infrastructure so people have better options for getting around easily and cheaply.
This work is picking up speed, with most states and territories in the midst of significant shared transport initiatives like the single biggest ever investment in public transport in Perth (Metronet), South Australia drawing up a new Public Transport Action Plan to improve connections, Brisbane and Western Sydney improving their bus services, and Australia’s largest electric bus depot under construction in Sydney’s Northern Beaches.
How do we build more momentum?
We can build on this work by stepping up the availability, frequency and reliability of shared and active transport.
We all want to live in places with clean air and great public spaces, where we can move around in ways that suit our needs, and feel safe on our streets.
Click the button below to see our plan to provide better access to shared transport to everyone in our cities.
Transport
Rail Freight
This metric tracks the amount of freight transported using rail as a proportion of all freight transported in Australia.
Where are we at?
When we think about how goods get around Australia, rail and road carry most of Australia’s freight, with a relatively small amount of domestic shipping and air freight. Of all freight-tonne kilometres travelled in 2022-23, 57% were by rail, 31% by road, 12% by coastal shipping and less than 1% by air.*
While rail moves the vast majority of bulk freight such as minerals and grain, 80% of packaged freight is transported by road. Packaged freight, also known as non-bulk freight, is a broad category that includes foods, drinks, produce, post and manufactured goods.
Why does this matter?
Transporting freight using rail produces much less climate pollution relative to road or air transport. This means we can cut climate pollution by reserving air freight for genuinely time-sensitive transport and take advantage of more rail freight for interstate transport of consumer goods and other non-bulk freight.
How do we build momentum?
We can further cut climate pollution from the movement of goods across Australia by shifting one-third of road freight to rail by 2030, by increasing the use of rail for packaged freight, and by electrifying more heavy road vehicles
* A freight-tonne kilometre is measured as moving one tonne of freight for one kilometre.
Transport
Electric Vehicle Registration
This metric tracks the number of electric cars and light commercial vehicles (like vans and utes) which have been registered in Australia.
Where are we at?
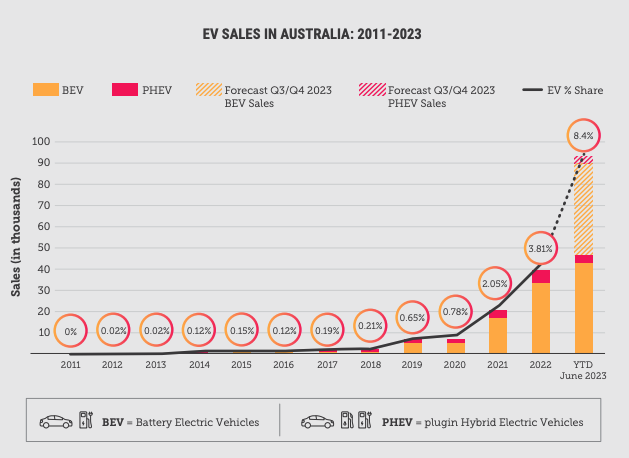
Electric vehicles (EVs) are taking off in Australia. The number of EVs sold in 2023 was more than double EV sales in 2022. This rapid rate of growth now sees electric vehicles make up 8.4 percent of all new cars sold, a 400-fold increase in sales over the past decade. As more consumers opt for cleaner and more affordable electric vehicles, the number of registrations is skyrocketing.

This metric is based on all electric or fuel cell cars and light commercial vehicles registered in Australia. Hybrid vehicles are not included.
Why does this matter?
For most successful new technologies, like microwaves or smartphones, the rate of uptake tends to follow an S-curve: after an initial period of slow uptake during what’s known as the ‘early adopter’ phase, there comes a point at which the product breaks through and a LOT more people start buying it, sending sales skyrocketing, before uptake levels off again after almost everyone who will make the switch has done so.
Data from other countries demonstrates that once EV sales pass 5 percent of new car sales, it typically signals a rapid acceleration in uptake. In 2023, Australia joined 22 other countries to pass this milestone.
How do we build more momentum?
Climate Council research has found that Australia can electrify our passenger fleet and see one-third of all passenger kilometres travelled by electric vehicles by 2030. An efficient way to achieve this is to prioritise electrifying vehicles that travel the most kilometres first, like taxis, rideshare vehicles and government fleets.
Energy
Electricity Generation
This metric represents the share of electricity in our main national grid (the NEM) generated from renewable sources in the last 12 months. The NEM powers most of Australia’s population, including Queensland, New South Wales, the Australian Capital Territory, Victoria, Tasmania and South Australia.
Where are we at?
Today, nearly 40% of the electricity in our main electricity grid comes from renewable power sources like the sun and wind. Almost four million households have taken control of their electricity bills by installing solar on their rooftop.
Why does this matter?
Australia’s ageing and increasingly unreliable coal-fired power stations are closing down, with the main grid operator expecting all coal generators will be retired by 2038 at the latest. To replace this capacity it is critical to keep building more renewables backed by storage, which is the most cost-effective way to add more capacity to the grid.
How do we build more momentum?
By the end of this decade, we can shift almost entirely away from polluting electricity sources, powering our lives with a bigger national grid made up of 94% renewables. To do this we need to continue putting solar on more rooftops, building more large-scale renewable capacity, and further bolster our grid to support clean export industries in the years ahead.
Energy
Household Battery Systems
This metric measures the number of household battery systems in Australia registered with the Clean Energy Regulator. Because this only includes batteries installed at the same time as solar systems, the total number of batteries is likely larger.
Where are we at?
More than 100,000 households have added a battery to their solar system. Governments are also investing in bigger community batteries, which share power between people in a local area.
Why does this matter?
Batteries help to shore up household renewable energy supply day and night, allowing homes to store surplus energy they’ve generated and use it when they need it.
How do we build more momentum?
If we install two million household batteries and nearly 5,000 community batteries, many more families can save money as we work towards powering Australia with 94% renewable energy.
Energy
Renewable Generation and Storage
This metric was calculated using the total capacity of renewable electricity generation and storage infrastructure in our main national grid (the NEM). This capacity refers to the total amount of electricity which could be generated if all of this infrastructure was used to 100% of its potential at the same time. It represents the amount of infrastructure available to generate or store electricity, not the amount of electricity which is actually generated or stored.
Where are we at?
Between existing rooftop solar and large-scale renewable projects already built, in the pipeline or expected to be underwritten by existing schemes, we are on track to build more than half the 113 GW of large-scale capacity needed.
Why does this matter?
With replacements in place we can end coal power generation and start phasing out gas. With our store of renewable energy strengthened, Australia can stop building new gas generation capacity unless it can run on 100% renewable hydrogen, and start reducing gas capacity in preparation for a complete phase out. Australia already has enough gas generation capacity today to meet occasional peaks in demand and troughs in renewable generation.
How do we build more momentum?
By expanding large-scale renewable electricity capacity we can meet our own energy needs and lay the foundation for new clean export industries.
Energy
Household Solar Installations
This metric measures the number of household solar systems across Australia registered with the Clean Energy Regulator.
Where are we at?
Australia is the world’s leader in rooftop solar. With more than 3.9 million households having already installed solar on their roof.
The Western Australian suburb of Falcon topped the list for the highest number of solar installations in WA for three consecutive years (2020-2023). Analysis by Solar Run using publicly available Clean Energy Council data found there were 1,303 solar panel installations in Falcon in 2023 Meanwhile, Queensland took out the state trophy with a whopping 54,365 statewide installations completed from January 2020 to December 2023.
Why does this matter?
Rooftop solar is one of the most efficient and effective ways to reduce emissions and for Australians across the nation to take back control of their power bills, saving an average of $1,500 a year.
How do we build more momentum?
To seize the sun and realise our household solar potential, we can double rooftop solar capacity by the end of the decade. This plan will empower millions of Aussies with cleaner, cheaper electricity, while strengthening our national grid and permanently cutting climate pollution across the economy. To do this, we can ramp up installations across more family homes, social housing and businesses. Read our plan to double rooftop solar this decade here.
Industry
Industrial Clean Energy Use
This metric measures the amount of clean energy used by industry (including mining, manufacturing, agriculture, and commercial services). Clean energy types include renewable biomass and bioenergy, solar, biofuels, and electricity. While electricity is currently generated with a mix of renewable and clean sources, industry can choose to purchase 100% renewable energy, and the grid is expected to rapidly shift to renewable sources this decade.
Where are we at?
Australia’s industrial sector is currently responsible for more than one third of total climate pollution, including 22% from mining and 12% from manufacturing. But making the move from fossil fuel-powered manufacturing to strong clean industries is a huge national opportunity.
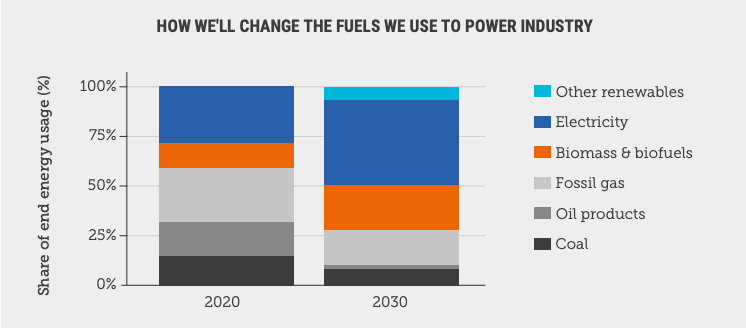
Right now, Australia’s industries are 23% powered by clean energy – up 4% since 2019. Our shift to clean manufacturing is happening, albeit slowly. However, with smart investments to adapt existing industries and capitalising on new mining and manufacturing opportunities, Australia can build an industrial base fit for the 21st century.
Just as our economy once “rode the sheep’s back” before shifting from agriculture to resources as its primary focus, Australia can rapidly scale up renewable energy and clean manufacturing to power generations of regional and national prosperity.
Why does this matter?
Mining and manufacturing produce enormous amounts of climate pollution. Coal, oil and gas are used as a fuel, a heat source and a feedstock in manufacturing and industrial production.

With the global economy rapidly shifting towards clean energy and demand for zero carbon products growing, Australia needs to develop new export opportunities that make use of our natural advantages in clean energy and critical minerals – the building blocks of the global clean industry economy – before it’s too late.
How do we build more momentum?
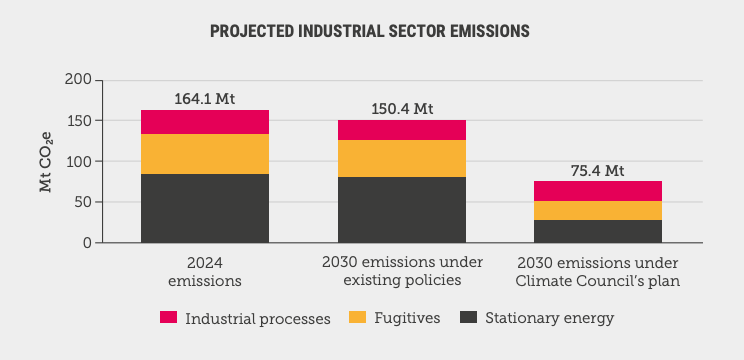
Climate Council’s research finds Australia can more than halve industrial climate pollution this decade. We can do this by using available technology like biomass and biofuels to make cement and manufacture metals, and by electrifying heavy mining machinery.
Dealing with “fugitive emissions” at existing coal sites, and strengthening our national environment laws – so they put a stop to new polluting projects – will help us make more big cuts to climate pollution, too.
Case study: Powering iron ore mining in the Pilbara with clean energy
Mining giant Rio Tinto is building large-scale solar to help power a new iron ore mine in Western Australia’s Pilbara region. Energy from this solar plant, together with battery storage at the nearby town of Tom Price, is set to replace some gas-fired electricity.
Rio Tinto operates four gas-fired power stations in the Pilbara, but will install two 100MW solar facilities and 200MWh of battery storage by 2026, on the way to installing 1 GW of renewables in the region by 2030. This will cut gas pollution, and operating costs, across their entire Pilbara operations.
Industry
Industrial Energy Efficiency
Where are we at?
Energy efficiency refers to the amount of energy required to produce goods and services. On average, if this value reduces over time, it means businesses can produce the same value of outputs with less energy. With much of the energy sources in our economy still linked to climate pollution, this means we can produce more of the things we need with a lower emissions impact.
Industrial energy efficiency in Australia capable of significant uplift this decade.

Why does this matter?
The industrial sector is Australia’s single biggest energy user, with manufacturing and mining together responsible for more than a quarter of Australia’s total energy demand.
There are smarter ways of making things that use less energy. Improving energy efficiency by switching from expensive and inefficient fossil gas to electricity or other zero carbon fuels, and upgrading to efficient new equipment or technologies can protect local industries from high gas prices while also cutting climate pollution.
How do we build more momentum?
The Federal Government’s “Powering the Regions Fund” has started funding industrial facilities to adopt new lower emissions technologies and renewable energy solutions. This is promising, but further dedicated funding is required to drive industrial energy efficiency at scale.
An “Industry Energy Efficiency Initiative” can identify best practice energy efficiency technologies and solutions across key sectors, and proactively engage with industrial facilities to adopt them. Facilities can then bid for grants on a reverse-auction basis to deliver improvements at the lowest cost. So industrial businesses are making best use of available government funding, and rapidly driving learning within their industry about effective and affordable energy efficiency measures.
* Clean energy includes electricity, which is currently generated with a mix of renewable and fossil-fuel sources, but can be rapidly shifted to renewable sources this decade.
Industry
Renewable Hydrogen Capacity
Where are we at?
Australia’s renewable hydrogen industry is in the early stages of development, and is expected to replace some industrial uses of fossil fuels as production costs and the upfront cost of manufacturing technologies reduce.
Renewable hydrogen is in a growth phase, with local businesses currently able to produce around 400 tonnes per year.* Australia’s production is on the brink of major growth, with more than 100 renewable hydrogen projects either in operation or under development.
Why does this matter?
Renewable hydrogen is made when clean energy, like wind and solar, is used to split water into oxygen and hydrogen. Hydrogen produced this way is an important building block for the global clean economy to replace fossil fuels in chemical manufacturing, industrial heat, some types of metal refining and some long-haul freight.
Clean hydrogen is an important economic opportunity for Australia, as coal and gas are phased out of our economy and those of our export partners. It has the potential to unlock new export industries in low-polluting products like green metals and ammonia.
How do we build more momentum?
To kick-start this growth industry, the Federal Government has focused on two incentives for clean hydrogen producers. The “Hydrogen Headstart” program supports development of large-scale renewable hydrogen projects, and the “Hydrogen Production Tax Incentive” will pay developers $2 for every kilogram of renewable hydrogen they make.
Establishing a strong renewable hydrogen industry in Australia now will pay huge long-term dividends, by enabling more onshore clean manufacturing and new export industries to drive our prosperity as the world keeps cutting climate pollution in the 2030s and beyond.
* This metric refers to hydrogen electrolyser capacity, which can be powered with 100% renewable electricity, albeit Australia’s grid is currently powered by about 40% renewable energy. However many hydrogen operators have purchase agreements in place to run their facilities from 100% renewable energy.
About this tool
Climate Momentum Monitor
Australia’s clean energy revolution is happening all around us. With more solar on rooftops, electric cars on roads and wind turbines on the horizon than ever before, we’re making progress towards a cleaner, safer future for our kids.
But, are we moving fast enough?
The Climate Council has developed a tool to track the “make or break” parts of our economy that need to slash climate pollution this decade here.
There’s a lot of data and juicy detail throughout its pages – below are some of the most frequently asked questions answered. Can’t see your question answered below? Email info@climatecouncil.org.au.
This tool was last updated with the most recent available data for each indicator on November 12th 2024.
FAQs
Can you explain the source of these indicators?
| Metric Name | Metric Description | Data source |
| Public transport trips | This metric tracks the number of times people used shared transport in our three biggest capital cities (Sydney, Brisbane and Melbourne) | Metric is based on the total number of trips over a consistent 12-month period. – Melbourne – Brisbane – Sydney |
| Shared travel | This metric assesses the rate at which shared travel has been taken up across Australia, tracking the share of kilometres travelled by passengers using shared transport, as a proportion of all travel using motorised options. | BITRE Australian Infrastructure and Transport Statistics Yearbook, Table 5.1 |
| Rail freight | This metric tracks the amount of freight transported using rail as a proportion of all freight transported in Australia. | BITRE, Australian Infrastructure and Transport Statistics Yearbook, Table 4.1c |
| Electric vehicle registrations | This metric tracks the number of electric cars and light commercial vehicles (like vans and utes) which have been registered in Australia. | BITRE, Road Vehicles, Australia. Table 4 |
| Electricity generation | This metric represents the share of electricity in our main national grid (the NEM) generated from renewable sources in the last 12 months. The NEM powers most of Australia’s population, including Queensland, New South Wales, the Australian Capital Territory, Victoria, Tasmania and South Australia. | Open Electricity, rolling 12-month renewable electricity generation share |
| Household batteries | This metric measures the number of household battery systems in Australia registered with the Clean Energy Regulator. Because this only includes batteries installed at the same time as solar systems, the total number of batteries is likely larger. | Clean Energy Regulator, Table 8 |
| Renewable generation and storage | This metric was calculated using the total capacity of renewable electricity generation and storage infrastructure in our main national grid (the NEM). This capacity refers to the total amount of electricity which could be generated if all of this infrastructure was used to 100% of its potential at the same time. It represents the amount of infrastructure available to generate or store electricity, not the amount of electricity which is actually generated or stored. | NEM Generation Information |
| Household solar installations | This metric measures the number of household solar systems across Australia registered with the Clean Energy Regulator. | Clean Energy Regulator, Table 5 |
| Industrial clean energy use | This metric measures the amount of clean energy used by industry (including mining, manufacturing, agriculture, and commercial services). Clean energy types include renewable biomass and bioenergy, solar, biofuels, and electricity. While electricity is currently generated with a mix of renewable and clean sources, industry can choose to purchase 100% renewable energy, and the grid is expected to rapidly shift to renewable sources this decade. | Australian Energy Statistics, Table F Industry based on the sum of energy use by mining, manufacturing, agriculture, and commercial services. Renewable energy sources include Wood, woodwaste, Bagasse, Solar energy, Electricity, Liquid/Gas biofuels. |
| Energy Efficiency | Energy efficiency refers to the amount of energy required to produce a certain output. In this case, energy efficiency measures the amount of energy required to produce $1 million of economic output. On average, if this value reduces over time, it means businesses don’t need to use as much energy to produce the same value of outputs. | Australian Bureau of Statistics, Australian National Accounts: National Income, Expenditure and Product. Table 6. GVA included for industries A-C, E-H, J-L, N – S agriculture, mining, manufacturing, construction, wholesale trade, retail trade, accommodation and food services |
| Green hydrogen capacity | This metric measures the total annual capacity of electrolysers to produce green hydrogen. Specifically, this metric refers to hydrogen electrolyser capacity, which can be powered with 100% renewable electricity, albeit Australia’s grid is currently powered by about 40% renewable energy. Many hydrogen operators have purchase agreements in place to run their facilities from 100% renewable energy. | CSIRO, HyResource Includes all operating electrolyser projects. |
Why did you focus on these three sectors: transport, energy and industry?
Answer: Our Seize the Decade research revealed that these sectors have the greatest potential to cut climate pollution this decade, with progress already starting in many cases. These sectors already have economically viable technologies available to support cleaner ways of making things, powering ourselves, and getting around. As such, we are particularly interested in tracking progress within these sectors.
Why have you chosen to focus on the metrics presented in this tool?
Answer: We’ve chosen to focus on these metrics because they are closely linked to progress on cutting climate pollution, and help to represent how energy, industry and transport is changing for the better.
Can I access the data set?
Answer: All of the underlying data sources for this tool are publically available, at the sources listed above. Because each data source is updated at different times, and may include important context and limitations for consideration when applying to different use cases, we recommend accessing the data from the primary source.
Will the tool be updated?
Climate Council will update this tool on an approximately quarterly basis, as new data is available. Subscribe to our email newsletter here to be kept in the loop.


