The Climate Risk Map is an interactive map tool that localises climate change impacts here in Australia. It allows you to find out the potential damage risk to properties in your local area, and see how these risks could increase over time if we fail to keep cutting climate pollution further and faster.
To get started, simply enter your suburb or postcode into the Climate Risk Map.
The information on this page is intended as a general guide only and should not be taken as constituting professional advice. For more information click here.
FAQs – Your Questions Answered
Which areas are most at risk?
A report published by Climate Council and Climate Valuation, “At Our Front Door”, identifies the ten most at-risk federal electorates today (based on the number of properties already at high risk). These are, in order:
- Hunter, NSW, which includes the following suburbs and towns: Lake Macquarie, Cessnock, Singleton
- Richmond, NSW, which includes the following suburbs and towns: Tweed Heads, Murwillumbah the whole of the Byron Shire plus Ballina
- Nicholls, VIC, which includes the following suburbs and towns: Shepparton, Seymour, Echuca, Mooroopna
- Mayo, SA, which includes the following suburbs and towns: Adelaide Hills, the Fleurieu Peninsula, Kangaroo Island, Mt Barker, McLaren Vale, Victor Harbor
- Brisbane, QLD, which includes the following suburbs and towns: Brisbane CBD, Fortitude Valley, New Farm and Newstead
- Page, NSW, which includes the following suburbs and towns: Casino, Lismore and Grafton, parts of Ballina Shire and northern parts of Coffs Harbour
- Maranoa, QLD, which includes the following suburbs and towns: Barcaldine, Winton, Longreach, parts of Toowoomba, Southern Downs, Goondiwindi
- Robertson, NSW, which includes the following suburbs and towns: Central Coast north of Sydney including Gosford, Terrigal, Woy Woy
- Bullwinkel, WA, which includes the following suburbs and towns: Kalamunda, Mundaring, Northam
- Dobell, NSW, which includes the following suburbs and towns: including Bateau Bay, the Entrance, Tuggerah
WHAT does “high” and “Moderate” risk mean?
High Risk Properties are defined as properties where there is a significant risk of insurance becoming unaffordable or withdrawn entirely due to the high risk of damage from extreme weather. Properties are considered ‘high risk’ when annual damage costs are equivalent to 1% or more of the property replacement cost.
Moderate Risk Properties are defined as properties where there is a significant risk of insurance becoming increasingly unaffordable due to risk of damage from extreme weather. Properties are considered ‘moderate risk’ when the annual damage costs are equivalent to 0.2-1% of the property replacement cost.
Even properties categorised as being at low risk are not free of risk. Climate impacts from the burning of fuels are endangering all Australians, our economy, the build and natural environment today.
WHAT DO THE DIFFERENT EMISSIONS SCENARIOS MEAN?
The Climate Risk Map allows you to explore extreme weather impacts under three different emissions scenarios. These scenarios are based on ‘Representative Concentration Pathways’ (RCPs) and Shared Socioeconomic Pathways’ (SSPs) used by the Intergovernmental Panel on Climate Change. The low, medium and high scenarios correspond with RCP 2.6/SSP1-2.6, RCP 4.5/SSP2-4.5 and RCP 8.5/SSP5-8.5 respectively.
The RCPs make predictions of how concentrations of greenhouse gases in the atmosphere will change in the future as a result of human activities. ‘Shared Socioeconomic Pathways’ (SSPs) are scenarios that explore how global society, demographics and economics might evolve and affect greenhouse gas emissions and climate change.
Extreme weather hazards, made more destructive by the burning of coal, oil and gas, are presented under three Shared Socioeconomic Pathways (SSPs):
Low emissions (SSP1-2.6): where global average temperature rise is very likely limited to around 1.3ºC to 2.4°C over the long term (2081-2100).
Medium emissions (SSP2-4.5) where nations deliver their existing current climate policies, very likely leading to a global average temperature rise of around 2.1ºC to 3.5°C by 2100.
High emissions (SSP5-8.5 “no action”): where the world fails to address the climate crisis, which corresponds with a very likely global average temperature range of around 3.3ºC to 5.7ºC by 2100.
HOW ARE THE DIFFERENT HAZARDS DEFINED?
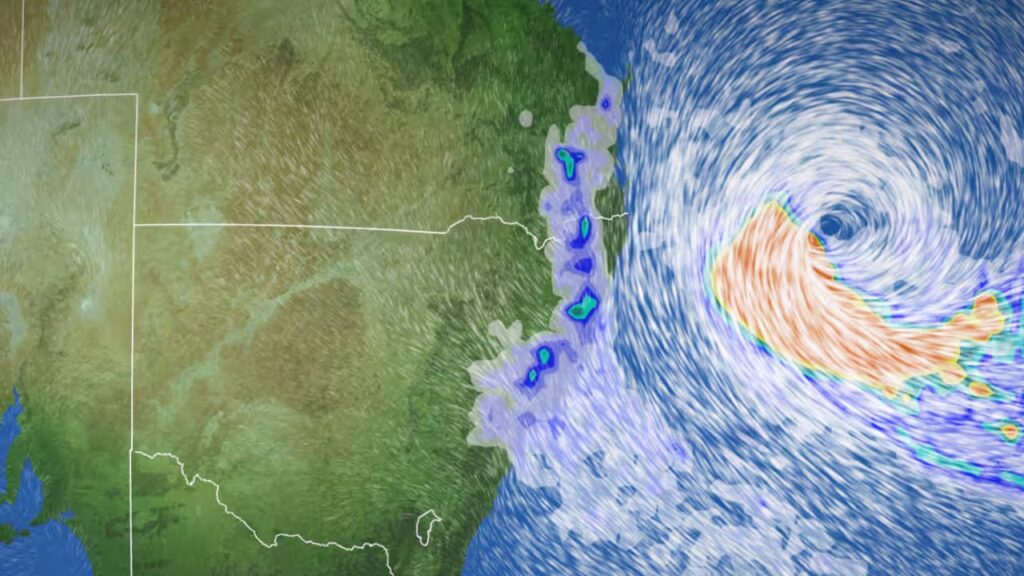
The map covers six different hazards which are exacerbated by burning coal, oil and gas: riverine flooding, surface water flooding, coastal inundation, bushfires, extreme wind and tropical cyclone wind. Here is how we define each of them:
- Extreme wind refers to unusually strong winds that exceed typical wind speeds associated with weather systems. Extreme winds often correlate with rapidly changing pressure gradients, typically associated with intense low-pressure systems or large storm events. Such winds can exceed a region’s building codes for wind resistance, causing damage.
- Surface water flooding (sometimes called “pluvial flooding”) occurs when rainfall exceeds the capacity of the ground, drainage systems, or infrastructure that exist to absorb or manage the water. This type of flooding can occur on flat or urbanised land where water cannot easily soak into the ground or is unable to flow into drainage systems efficiently. Pluvial flooding typically results from heavy or intense rainfall over a short period, which overwhelms the drainage capacity of an area and causes water to pool.
- Riverine flooding (sometimes called “fluvial flooding”) occurs when a river, stream, or other watercourse exceeds its capacity and overflows onto surrounding land. This type of flooding is typically caused by prolonged or intense rainfall, rapid snowmelt, or overflow of dams and levees. The severity of a riverine flood depends on factors such as the volume of water, terrain, and the capacity of the river channel. Riverine flooding can damage low-lying buildings and infrastructure.
- Coastal inundation is when seawater floods due to high tides, wind, low air pressure and storm surge damage coastal land, infrastructure and buildings. Rising seas due to climate change means more coastal inundation.
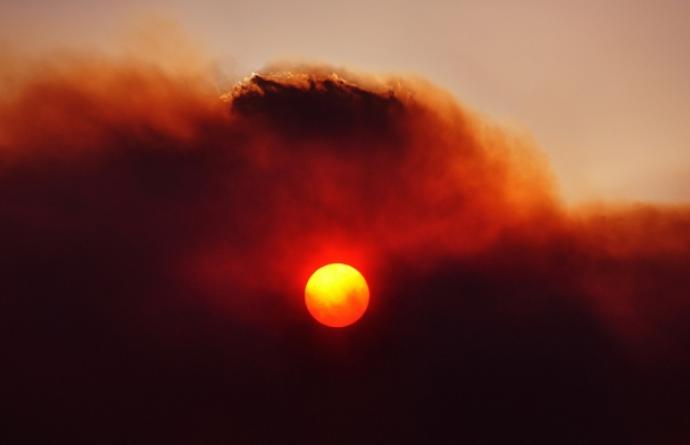
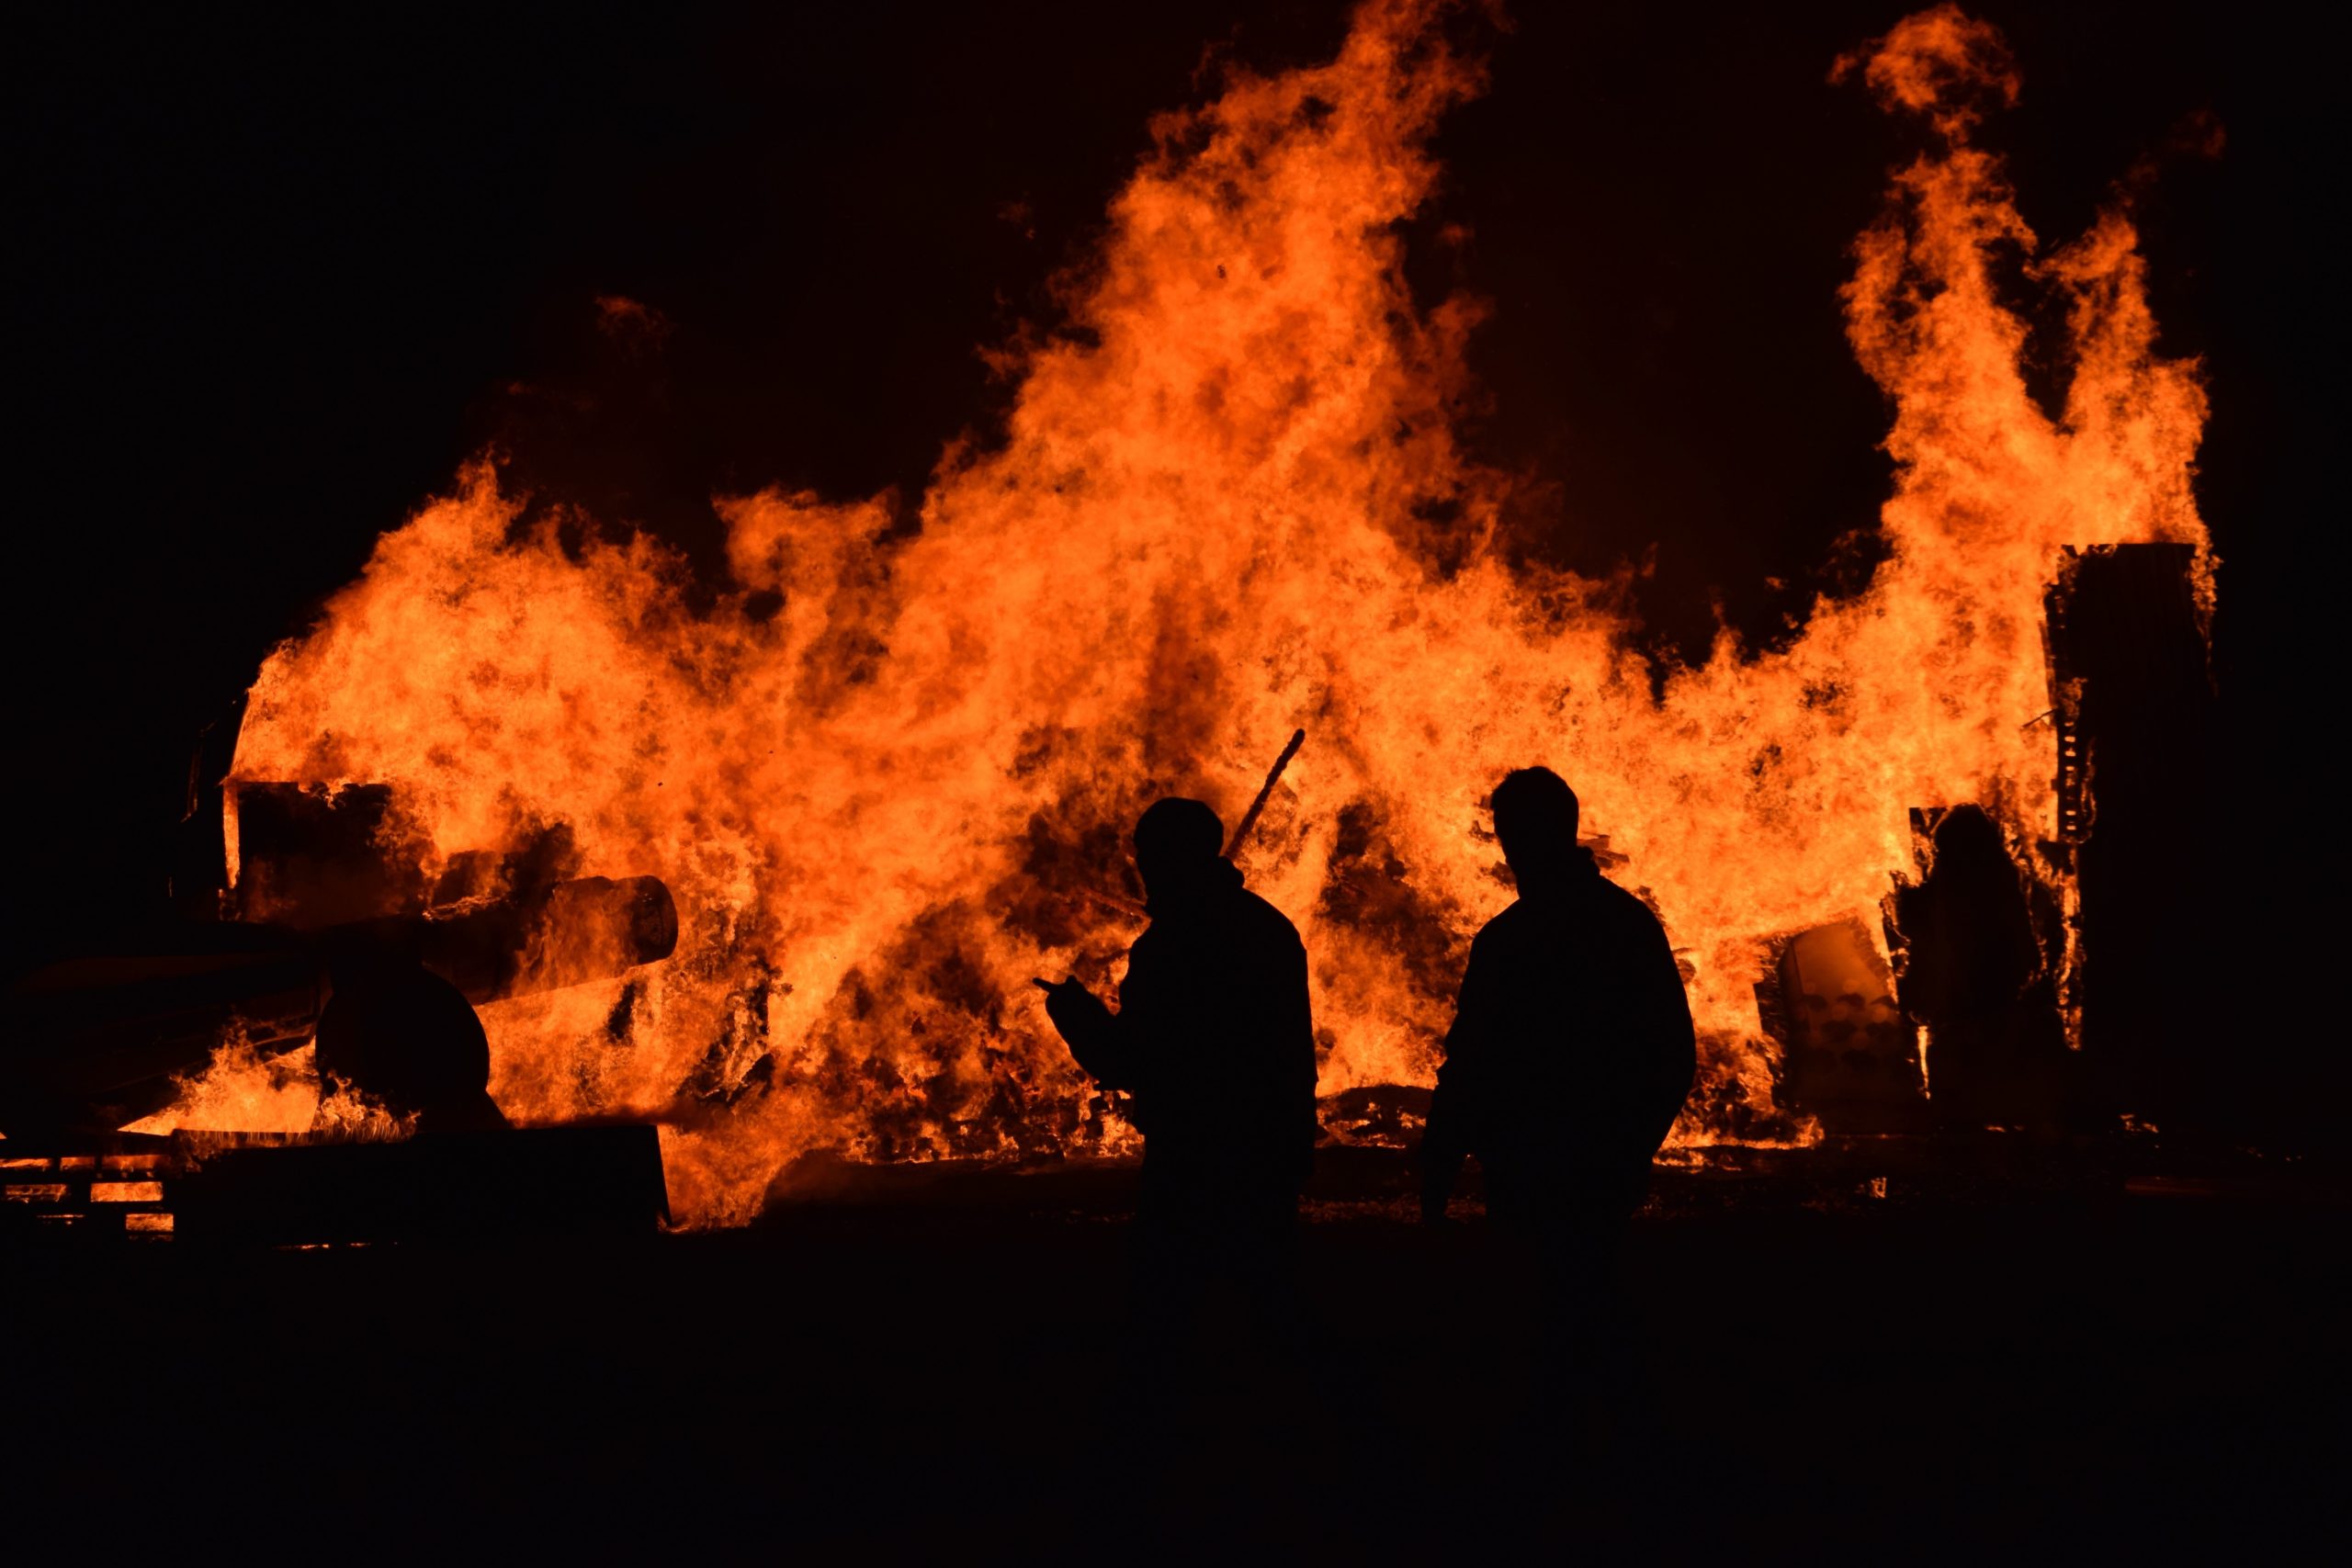
- Bushfires are destructive fires that spread via trees and forests. This definition does not include grassfires. Flames and heat from burning vegetation can damage buildings and infrastructure. Australia is experiencing an increased incidence of dangerous bushfire weather due to more days with higher temperatures, high wind speeds and drier conditions.
- Tropical cyclone wind is the strong, rotating winds associated with tropical cyclones. These cyclones are intense low-pressure systems that form over warm ocean waters in tropical and subtropical regions of Australia, and are exacerbated by warming sea surface temperatures. Extreme wind speeds generated by cyclones can cause extensive damage to buildings and infrastructure, particularly those with weak structures, poor construction, or made of lightweight materials.
The analysis does not cover lightning strikes and hail or additional damage caused by cyclones such as storm surge or flying debris.
Why is climate risk in 2025 modelled under the “high emissions” scenario?
The Climate Risk Map allows you to explore extreme weather impacts under three scenarios. The high emission scenario is based on the ‘Representative Concentration Pathways’ and Shared Socioeconomic Pathways’ (SSPs) used by the Intergovernmental Panel on Climate Change (RCP 8.5/SSP5-8.5), and shows extreme weather impacts if the world fails to address the climate crisis.
Unfortunately, this is the pathway the world is currently on. Digging up and burning coal, oil and gas is blanketing Earth in heat-trapping pollution that supercharges extreme weather. Globally, 2024 was the hottest on record, with record high levels of global climate pollution. We are not on track to meet the climate commitments agreed to by nation states. Therefore, Australians should be presented with climate risks, even now in 2025, that are based upon the world failing to address the climate crisis.
Want to learn more about how climate change impacts Australian communities?
Our report, At our front door, finds over 2 million homes and businesses are at high or moderate risk today from worsening extreme weather driven by climate pollution. homes and businesses are the suburbs across Australia where properties face the most acute risk from climate-fuelled extreme weather events.
Important notice
The information on this page is for general information only. It represents the views of the Climate Council of Australia Ltd based on climate risk analysis undertaken by Climate Valuation and should not be taken as constituting professional advice. Because it is intended only as a general guide, it may contain generalisations. You should consider seeking independent legal, financial, taxation or other advice to check how the information contained on this page relates to your unique circumstances. Climate Council of Australia Ltd is not liable for any loss caused, whether due to negligence or otherwise arising from the use of, or reliance on, the information provided directly or indirectly, by use of this page