This article, written by Climate Councillor Joelle Gergis, was originally published on The Conversation on March 24th 2021.
Over the past three years, I’ve been working on the forthcoming report by the United Nations’ Intergovernmental Panel on Climate Change. I’m a climate scientist who contributed to the chapter on global water cycle changes. It’s concerning to think some theoretical impacts described in this report may be coming to life – yet again – in Australia.
The recent flooding in New South Wales is consistent with what we might expect as climate change continues.
Australia’s natural rainfall patterns are highly variable. This means the influence climate change has on any single weather event is difficult to determine; the signal is buried in the background of a lot of climatic “noise”.
But as our planet warms, the water-holding capacity of the lower atmosphere increases by around 7% for every 1℃ of warming. This can cause heavier rainfall, which in turn increases flood risk.
The oceans are also warming, especially at the surface. This drives up both evaporation rates and the transport of moisture into weather systems. This makes wet seasons and wet events wetter than usual.
So while Australia has always experienced floods, disasters like the one unfolding in NSW are likely to become more frequent and intense as climate change continues.
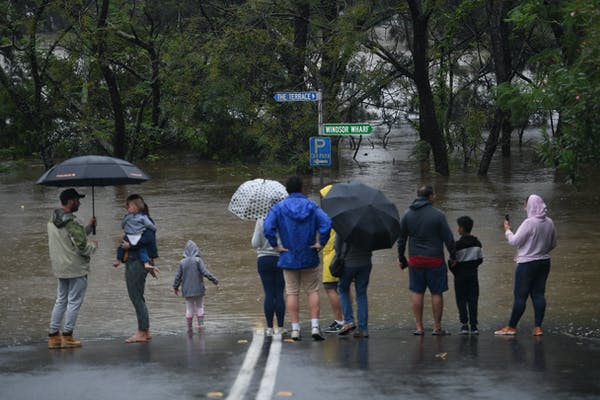
Flooding is likely to become more severe as the planet warms. AAP
Understanding the basics
To understand how a warming world is influencing the water cycle, it’s helpful to return to the theory.
From year to year, Australia’s climate is subject to natural variability generated by the surrounding Pacific, Indian and Southern oceans. The dominant drivers for a given year set up the background climate conditions that influence rainfall and temperature.
It is a combination of these natural climate drivers that makes Australia the land of drought and flooding rains.
However, Australia’s climate variability is no longer influenced by natural factors alone. Australia’s climate has warmed by 1.4℃ since national records began in 1910, with most of the warming occurring since 1970. Human-caused greenhouse emissions have influenced Australian temperatures in our region since 1950.
This warming trend influences the background conditions under which both extremes of the rainfall cycle will operate as the planet continues to warm. A warmer atmosphere can hold more moisture (higher water vapour content), which can lead to more extreme rainfall events.
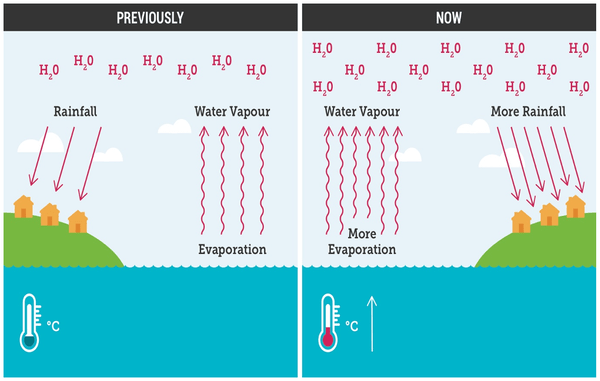
A warmer atmosphere can hold more moisture which can lead to more extreme rainfall events. Climate Council
Since the winter of 2020, Australia has been influenced by the La Niña phase of the El Niño–Southern Oscillation (ENSO). Historically, sustained La Niña conditions, sometimes with the help of a warmer than average Indian Ocean, have set the scene for severe flooding in eastern Australia.
During these events, easterly winds intensify and oceans around Australia warm. This is associated with the Walker Circulation – a giant seesaw of atmospheric pressure that influences the distribution of warm ocean waters across the Pacific Ocean.

Ocean and atmospheric conditions associated with La Niña conditions. Bureau of Meteorology
The last La Niña occurred in 2010–2012. It led to widespread flooding across eastern Australia, with particularly devastating effects in Queensland. The event caused the wettest two-year period in the Australian rainfall record, ending the 1997–2009 Millennium Drought.
Oceanographers from UNSW studied the exceptional event. They demonstrated how a warmer ocean increased the likelihood of extreme rain during that event, primarily through increased transport of moist air along the coast.
Their analysis highlighted how long‐term ocean warming can modify rain-producing systems, increasing the probability of extreme rainfall during La Niña events.
It is important to point out that changes in large-scale atmospheric circulation patterns are still not as well understood as fundamental changes in thermodynamics. However, because regional rainfall changes will be influenced by both factors, it will take researchers time to tease everything out.
So what about climate change?
The theoretical changes to the global water cycle are well understood. However, determining the contribution of natural and human influences on climate variability and extremes – known as “attribution” – is still an emerging science.
More studies are needed to distinguish natural or “background” rainfall variability from recent human-caused changes to the water cycle. This is particularly the case in a country like Australia, which has very high yearly rainfall variability. This contrasts with some regions of the Northern Hemisphere with less variable rainfall, where a clear climate change signal has already emerged.
Right now, La Niña conditions are decaying in the Pacific Ocean. As expected, the 2020–2021 La Niña has brought above-average rainfall to much of eastern Australia. This helped ease the severe drought conditions across eastern Australia since 2017, particularly in NSW.
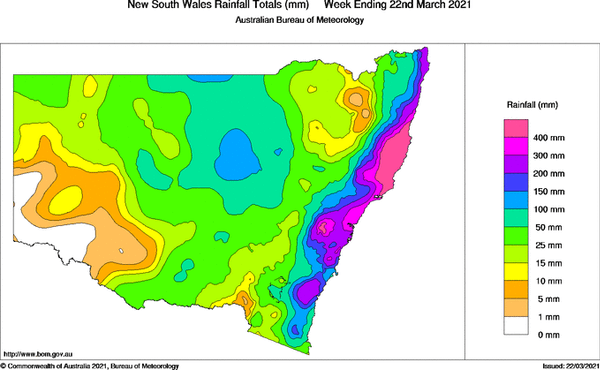
NSW rainfall totals for the week ending March 22, 2021. Bureau of Meteorology
What’s interesting about the 2020–2021 La Niña is that it was weak compared with historical events. The relationship between La Niña and rainfall is generally weaker in coastal NSW than further inland. However, it’s concerning that this weak La Niña caused flooding comparable to the iconic floods of the 1950s and 1970s.
The rainfall totals for the current floods are yet to be analysed. However, early figures reveal the enormity of the downpours. For example, over the week to March 23, the town of Comboyne, southwest of Port Macquarie, recorded an extraordinary 935mm of rainfall. This included three successive days with more than 200mm.
The NSW coast is no stranger to extreme rainfall – there have been five events in the past decade with daily totals exceeding 400mm. However, the current event is unusual because of its duration and geographic extent.
It’s also worth noting the current extreme rainfall in NSW was associated with a coastal trough, not an East Coast Low. Many of the region’s torrential rainfall events in the past have resulted from East Coast Lows, although their rainfall is normally more localised than has been the case in this widespread event.
Remember that as the air warms, its water-holding capacity increases, particularly over the oceans. Current ocean temperatures around eastern and northern Australia are about 1℃ warmer than the long-term average, and closer to 1.5℃ warmer than average off the NSW coast. These warmer conditions are likely to be fuelling the systems driving the extreme rainfall and associated flooding in NSW.
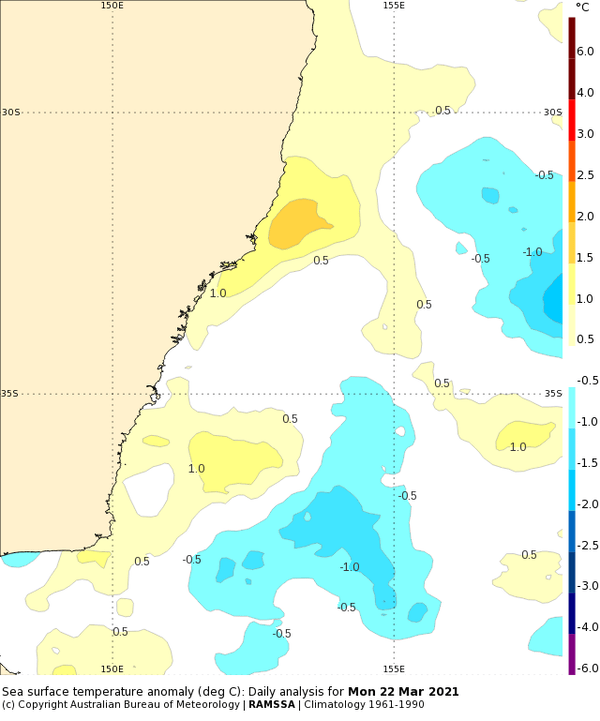
Sea surface temperature anomalies along the NSW coast. Bureau of Meteorology
A nation exposed
Weather and climate are not the only influences on extreme flood events. Others factors include the shape and size of water catchments, the presence of hard surfaces in urban areas (which cant’t absorb water), and the density of human settlement in flood-prone areas.
The Hawkesbury–Nepean region in Western Sydney, currently experiencing major flooding, is a prime example. Five major tributaries, including the Warragamba and Nepean Rivers, flow into this extensively urbanised valley.
Improving our understanding of historical weather data may help improve future climate change risk assessment. For example, past floods in the Hawkesbury–Nepean have been a lot worse than the current disaster. In 1867, the Hawkesbury River at Windsor reached 19.7 metres above normal, and in 1961 peaked at 14.5 metres. This is worse than the 13.12 metres above normal recorded at Freemans Reach on March 23.
It’s sobering to think the Hawkesbury River once peaked 6 metres higher than what we’re seeing right now. Imagine the potential future flooding caused by an East Coast Low during strong La Niña conditions.
It will take time before scientists can provide a detailed analysis of the 2020–2021 La Niña event. But it’s crystal clear that Australia is very exposed to damage caused by extreme rainfall. Our theoretical understanding of water cycle changes tells us these events will only become more intense as our planet continues to warm.

